Website conversion rate is the most quoted and least useful number in dealership marketing. A blended figure averages bot traffic, service customers, researchers and buyers into a single percentage that describes none of them — and four segments turn it into something you can act on.
This guide covers the definition traps, the four segments, what good looks like within each, where the measurement goes wrong, and what to measure.
The definition traps
Three choices decide the number before any analysis begins, and each one flatters it.
Trap 1 — the denominator. Sessions, users or pageviews produce different numbers from the same traffic. Bot traffic is a substantial share of the web, and a denominator including it depresses the rate while a filter that is too aggressive inflates it. Pick one, document it, keep it.
Trap 2 — the numerator. A phone call, a chat with contact details, a form submission and a saved vehicle are all conversions and they are not equivalent. Counting only form fills understates; counting everything including a newsletter signup overstates.
Trap 3 — the window. A visitor who browses Tuesday and submits Saturday converted, and whether your analytics attributes it depends on the attribution window — the broader problem in lead attribution.
None of the three has a correct answer. All three need a documented choice that does not move, because a definition that drifts makes every historical comparison meaningless.
The four segments
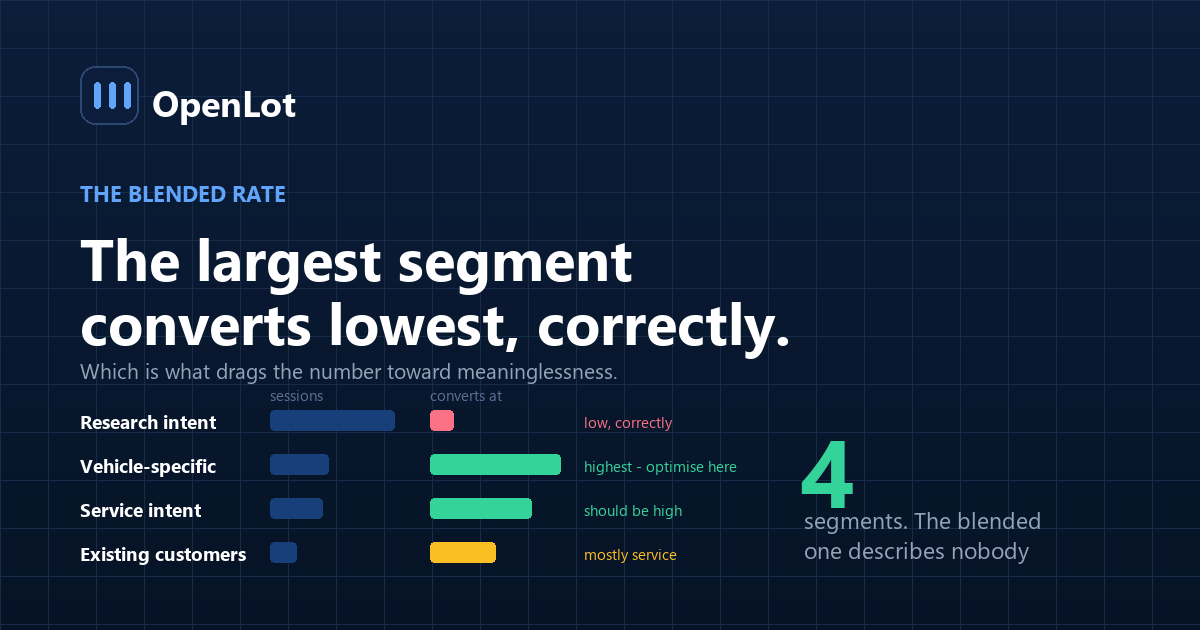
One number becomes four, and all four are usable
Illustrative shape. Compute your own — the spread is the point.
Segment Share of sessions Converts at Filtered non-human traffic Removed — Service intent Moderate High — booking is easy Research intent Largest Low, correctly Vehicle-specific intent Moderate Highest Existing customers Small Variable, mostly service The blended rate is dominated by the research segment, which is the largest and converts lowest for good reasons — those visitors are early, and a site optimised to convert them would be optimised to pressure people who are not ready.
The vehicle-specific segment is the one to optimise. A visitor on a vehicle detail page has done the work of choosing, and the conversion question there is narrow and answerable: what is blocking them?
What does good look like, by segment?
Not a benchmark number — a direction and a diagnostic.
Vehicle-specific intent. The highest-converting segment, and the one where chat placement and listing completeness matter most. If this segment converts poorly, the usual causes are missing information on the page, no price, poor photos, or no low-commitment next step.
Service intent. Should convert well because the task is simple. If it does not, the booking flow is the cause — the abandonment pattern in why service booking gets abandoned.
Research intent. Low conversion is correct. The useful metric here is return rate rather than conversion: did they come back? A site that converts researchers aggressively is a site that annoys the majority of its traffic.
Existing customers. Mostly service, and the measure is whether they can do what they came for without calling.
Where does the measurement go wrong?
1. Quoting a blended rate. The whole subject above.
2. Comparing to an industry benchmark. Different traffic mixes, different definitions, different counting. Your own trend by segment is worth more than anyone else's level.
3. Optimising for the researchers. The largest segment and the one least ready, which is how sites end up with aggressive popups.
4. Counting low-intent conversions. Newsletter signups inflate the number and produce nothing.
5. A moving definition. Any change to numerator, denominator or window makes the history unusable.
6. Ignoring phone conversions. For many dealerships the phone is a large share of conversions and it is invisible in web analytics without call tracking — the leak sized in missed calls.
7. Treating chat as separate. A chat producing contact details is a conversion and belongs in the numerator — and whether chat is helping or hurting is its own measurement.
What should you measure?
| Metric | How to compute | What it decides |
|---|---|---|
| Conversion by segment | Four segments, documented definitions | The actionable version |
| Vehicle-page conversion | Conversions ÷ VDP sessions | The segment worth optimising |
| Conversion by device | Mobile vs desktop | Usually a large gap |
| Phone conversions | From call tracking, matched to sessions | Frequently invisible |
| Return rate, research segment | Returning ÷ research sessions | The right metric for that segment |
| Days to first enquiry, by vehicle | Listing → first lead | Which listings are not working |
Row three usually produces the largest single finding. Most dealership traffic is mobile and most dealership sites were designed on a desktop, and the gap between the two conversion rates is frequently wide enough to justify a redesign on its own.
Row six connects the website number to inventory: a vehicle generating no enquiries is a listing problem, and that is a merchandising fix rather than a site-wide one.
Frequently asked questions
Why is a blended website conversion rate not useful?
Because it averages bot traffic, service customers, early researchers and vehicle-specific buyers into one percentage that describes none of them. The research segment is usually the largest and converts lowest for entirely correct reasons, which drags the blended figure toward meaninglessness.
How should dealership web traffic be segmented?
Four ways after filtering non-human traffic: service intent, research intent, vehicle-specific intent, and existing customers. Each converts at a very different rate and each has a different correct response when the rate is low.
Which segment should be optimised?
Vehicle-specific intent. Those visitors have already chosen a car, so the conversion question is narrow and answerable — usually missing information on the page, no price, poor photographs, or no low-commitment next step.
Should researchers be converted aggressively?
No. Low conversion among early researchers is correct, and a site optimised to convert them is optimised to pressure people who are not ready. The right metric for that segment is return rate rather than conversion.
What definition traps affect the number?
Three: the denominator, since sessions, users and pageviews produce different figures and bot filtering shifts them further; the numerator, since calls, chats, forms and saved vehicles are not equivalent; and the attribution window, since a visitor who browses Tuesday and submits Saturday may or may not be counted.
Should phone calls count as website conversions?
Yes, and for many dealerships they are a substantial share. Without call tracking they are invisible in web analytics entirely, which understates the site's contribution and misdirects optimisation toward form fills.
Is an industry benchmark useful here?
Rarely. Published figures reflect different traffic mixes, different conversion definitions and different counting of phone and chat. Your own trend by segment produces decisions; someone else's level produces an argument.
What usually produces the biggest single finding?
Splitting conversion by device. Most dealership traffic is mobile and most dealership sites were designed on desktops, and the gap between the two rates is frequently wide enough to justify the redesign by itself.
Conclusion
- The blended rate describes nobody. Four segments make it actionable.
- Research traffic converts low, correctly. Optimising for it produces popups.
- Vehicle-specific intent is the segment to work on, and the diagnosis there is narrow.
- Document numerator, denominator and window. A drifting definition erases the history.
- Split by device. The gap is usually the largest finding available.
Last updated: