Dealership lead attribution is the practice of determining which marketing sources actually produce sold units, not just leads. Most stores measure cost per lead and stop there — which is how a source that delivers cheap leads that never close keeps its budget, while a source producing expensive leads that reliably sell gets cut.
This guide covers the metric that matters, why vendor reports overstate, the tracking gaps that break attribution, and a practical method for a store that has never done it.
Why cost per lead is the wrong metric
Cost per lead measures what you buy. Cost per sale measures what you get.
The gap between them is close rate, and close rate varies enormously by source. A marketplace lead and a walk-in referral are not the same product at the same stage of the buying process, and averaging them hides the thing you need to know.
Why the ranking flips
Illustrative numbers — run this with your own.
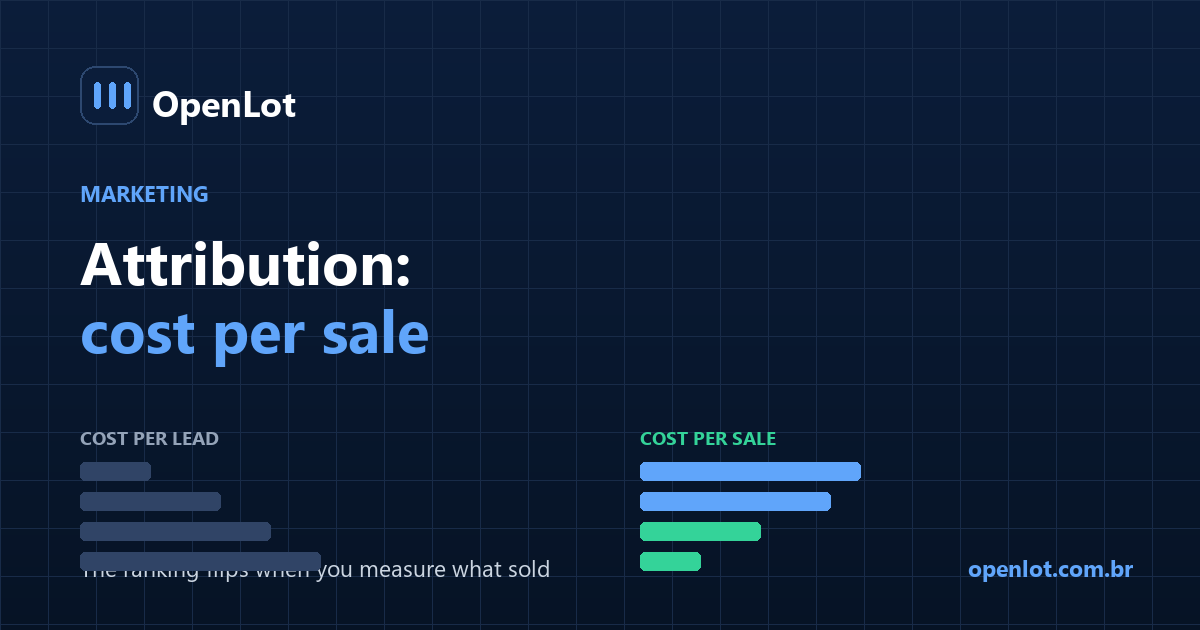
Source Spend Leads CPL Close rate Sold Cost/sale Marketplace A $6,000 300 $20 4% 12 $500 Paid search $8,000 160 $50 11% 18 $444 Website organic $2,000 60 $33 18% 11 $182 Referral $500 20 $25 35% 7 $71 Ranked by cost per lead, Marketplace A looks like the best buy and paid search the worst.
Ranked by cost per sale, the order nearly inverts. Marketplace A becomes the most expensive way to sell a car, and organic — which generates the fewest leads — is among the cheapest.
Stores that budget on CPL systematically overfund high-volume, low-intent sources. The correction usually costs nothing; it is a reallocation, not an increase.
The point is not that marketplaces are bad. It is that cost per lead cannot tell you which is which, and it is the number most dealership marketing reports lead with.
Why vendor reports add up to more cars than you sold
Every vendor reports the conversions it can see. A customer who saw a paid search ad, browsed a marketplace, visited your site, then called will appear in three or four vendor dashboards as a win.
Sum those reports and you sold 140 cars in a month you sold 95. This is not usually dishonesty — it is each vendor measuring its own touchpoint with no visibility into the others.
Three specific distortions:
Last-click over-credits the bottom of the funnel. Whatever the customer touched last gets the sale. Branded search — where someone types your store's name because another channel made them aware of you — routinely absorbs credit for demand it did not create.
First-click over-credits the top. The inverse problem, and the reason neither model alone is sufficient.
Self-reported attribution is unreliable. "How did you hear about us?" gets answered with whatever comes to mind. Customers genuinely do not remember, and the answer skews toward the most memorable brand rather than the source that produced the visit.
The DMS is the only system that knows what actually sold. Attribution that does not terminate in the DMS is a vendor's opinion.
What you need to track
Attribution breaks at the joins. Four links, each a common failure point:
| Link | What it requires | Common failure |
|---|---|---|
| Source → lead | UTM parameters or source tagging on every lead | Forms that capture no source |
| Lead → customer | Deduplicated customer record | Same person as three lead records |
| Customer → deal | CRM-to-DMS match | Name mismatch, no shared key |
| Deal → cost | Spend by source for the same period | Spend tracked monthly, sales tracked by deal date |
The deduplication problem
This is the one that quietly destroys attribution.
A customer submits a form on your site Tuesday, a marketplace lead Wednesday, and calls Friday. Three lead records, one human, one eventual sale. Depending on how your CRM merges them — or does not — that sale gets credited to one source, split across three, or counted three times.
Before trusting any attribution report, check how many of your "leads" are duplicate humans. Stores measuring this for the first time commonly find 15–30% duplication across sources, which means close rate by source is being computed on an inflated denominator.
UTM tagging, minimally
Every link you control that can reach your site should carry source tagging, and your lead form should capture it. At minimum utm_source, utm_medium and utm_campaign, plus gclid for Google Ads.
The common gap is that the form captures the UTM of the page it sits on, not the UTM of the session's entry. A customer who lands on a tagged campaign page, browses to inventory, then submits a form there will be attributed to the inventory page unless the tags are persisted across the session.
A practical method for a store starting from zero
You do not need an attribution platform to make real progress.
- Pull 12 months of sold units from the DMS. Deal date, customer name, vehicle, gross.
- Pull 12 months of leads from the CRM, with source and date.
- Match on customer, not on lead. Deduplicate first — collapse multiple lead records for the same person into one customer with a list of touched sources.
- Apply two attribution models, not one. First-touch and last-touch, side by side. Where they agree, you have confidence. Where they disagree, you have found a source that assists but does not close, or vice versa — which is a real finding, not a problem to resolve.
- Add spend by source for the same period, including vendor fees and agency costs.
- Compute cost per sold unit, by source, and compare it to cost per lead. Note which sources move.
- Check gross, not just units. A source producing cheap sales at thin gross may rank worse than the unit count suggests.
Step three is where most attempts collapse, and it is worth doing manually the first time — a spreadsheet of 12 months of deals is tedious but finite, and the duplication rate you discover will inform everything after.
The multi-touch question
Full multi-touch attribution — assigning fractional credit across every touchpoint — is worth doing eventually and is not where a store should start.
First-touch and last-touch run side by side answer most budget questions. The sources where the two models disagree sharply are the ones worth investigating further. Buying an attribution platform before fixing deduplication produces sophisticated reports built on bad joins.
What to do with the answer
Reallocate before you increase. The first output of honest attribution is almost always that spend is misallocated, not insufficient.
Cut slowly and measure. A source that looks expensive on last-click may be feeding awareness that shows up as organic and branded search. Reduce it and watch whether those decline.
Track cost per sale monthly. Attribution is not a project that concludes. Source economics shift with market conditions and vendor pricing.
Hold vendors to your numbers, not theirs. When a vendor's report disagrees with your DMS-matched analysis, your DMS is the one that knows what sold.
Frequently asked questions
What is a good cost per sold unit for a dealership?
It varies by market, price band and whether you count only variable advertising or fully loaded marketing cost. Rather than chasing an industry benchmark, compare sources against each other within your own store and trend the blended number over time.
Why do vendor reports claim more sales than my dealership made?
Each vendor sees only its own touchpoint and credits itself when a customer it touched buys. A customer who touched four channels produces four claimed conversions. Only the DMS knows what actually sold.
Should I use first-click or last-click attribution?
Run both. Last-click over-credits bottom-of-funnel sources like branded search; first-click over-credits the top. Sources where the two models disagree sharply are the ones worth investigating.
How do I attribute walk-ins and phone calls?
Call tracking numbers unique to each source handle phone attribution. Walk-ins are harder and self-reported answers are unreliable — many stores treat walk-ins as a separate bucket rather than forcing a source onto them.
How much lead duplication is normal?
Stores measuring it for the first time commonly find 15–30% of lead records represent a customer already in the system from another source. Deduplicate before computing close rate by source, or the denominator is wrong.
Do I need an attribution platform to do this?
Not to start. A DMS export, a CRM export and a spreadsheet will answer the main budget questions. Buy a platform when manual analysis becomes the bottleneck — not before deduplication is solved, because a platform will inherit the same bad joins.
Should I measure attribution on units or on gross?
Both. A source producing high unit volume at thin gross can rank well on cost per sale and poorly on contribution. Adding gross to the analysis frequently changes the ranking again.
Conclusion
- Cost per lead measures what you buy; cost per sale measures what you get. The ranking often inverts between them.
- Vendor reports overlap. Sum them and you sold more cars than you did.
- Deduplicate before anything else. 15–30% duplication is common and it corrupts every downstream number.
- Run first-touch and last-touch together. Disagreement between them is information, not noise.
- Attribution terminates in the DMS. Anything that does not match back to sold units is an opinion.
Start with one month: export leads, export deals, deduplicate, match. The duplication rate alone usually changes how you read every report you already have.
Last updated: