Used car inventory is managed in most stores as three separate activities — buying, pricing and clearing — performed by the same person at different moments. They are one system with a specific order of causation, and the reason aged units appear is almost always a decision made two steps earlier.
This guide covers the four decisions and how they compound, where AI helps in each, how to read an aging profile, where inventory tools fail, and what to measure.
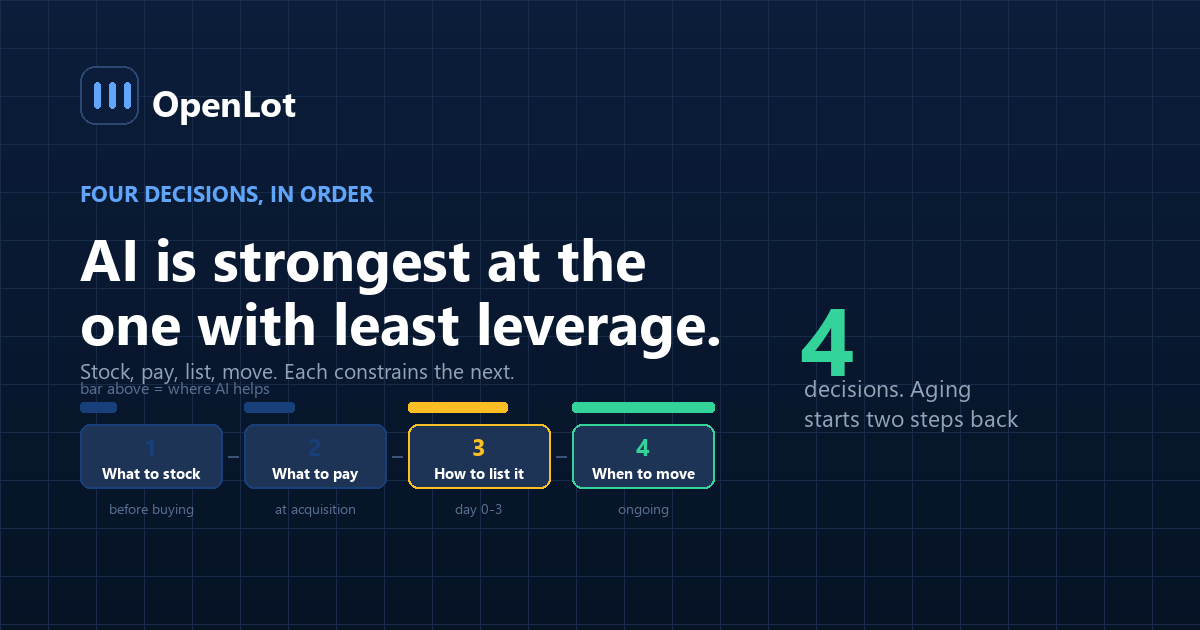
The four decisions, in order
| # | Decision | Made when | Consequence if wrong |
|---|---|---|---|
| 1 | What to stock | Before buying | Wrong car. No price fixes it |
| 2 | What to pay | At acquisition | Margin is set here, permanently |
| 3 | How to list it | Day 0–3 | Determines whether anyone sees it |
| 4 | When and how to move | Ongoing | The only lever left |
The order matters because each decision constrains the ones after it. A unit bought wrong can only be managed, never fixed, which is why aging starts at acquisition rather than at day 60.
Most stores spend nearly all their management attention on decision 4, which is the one with the least room left in it.
Where does AI help, by decision?
1. What to stock — moderately. Market data shows what sells and at what speed in your radius. The limit is that your store's actual results are a thin sample, which is the predictive stocking problem: regional averages describe a market you only partly serve.
2. What to pay — moderately. Appraisal support gives a consistent starting number, and the gap between appraised and realised is measurable over time. It cannot see the car, which is the subject of appraisal blind spots.
3. How to list it — substantially. Description generation, photo sequencing and completeness checks are genuinely good, and listing quality is measurable in traffic per unit.
4. When and how to move — most of all. Repricing signals and aging alerts, which is where the arithmetic breaks down manually and where software does most of its useful work.
The honest pattern: AI is strongest at the decision with the least leverage. That is not an argument against it — decision 4 still matters and nobody is doing it well by hand — but it explains why stores that fix only repricing see a smaller gain than expected.
How do you read an aging profile?
The distribution tells you which decision is failing. One number does not.
Reading the shape
Illustrative. Bucket your own inventory and compare the shape rather than the total.
Days in stock Healthy Store A Store B 0–30 55% 58% 34% 31–45 25% 24% 26% 46–60 13% 11% 21% 60+ 7% 7% 19% Store A looks fine and is fine.
Store B has a tail, and the tail is not the problem — it is the symptom. The thin 0–30 band says units are not selling quickly even when fresh, which points at decisions 1 and 2 rather than at repricing. Discounting the 60+ units clears the symptom and the shape returns next quarter.
The diagnostic question is always: did these units ever sell well, or were they slow from day one? Pull days-to-first-enquiry and the answer is usually obvious.
Which decision is failing?
| Pattern | Likely cause |
|---|---|
| Thin 0–30 band, long tail | Stocking or acquisition price. Repricing will not fix it |
| Healthy 0–30, thick 46–60 | Repricing cadence. The units were fine and nobody touched them |
| Units with no enquiries at all | Listing quality — photos, description, completeness |
| Aging concentrated in one segment | Stocking a segment your market does not support |
| Everything slow, evenly | Price position across the board, or a market shift |
| Aging starts at front-line date | Recon, hidden by how days-in-stock is counted |
The last row is a measurement artefact rather than an inventory problem, and it is common enough to check first. If days-in-stock counts from front line rather than acquisition, every number here understates by the length of recon.
Where do inventory tools fail?
1. Treating the tail as the problem. Discounting aged units clears this quarter's symptom and leaves the cause intact.
2. Stocking to regional averages. Your market is a subset, and the average includes stores whose customers are not yours.
3. Automatic pricing with no review. Covered in AI pricing blind spots.
4. No feedback loop to acquisition. The system flags aged units and nobody tells the buyer which segments keep producing them.
5. Days-in-stock from the wrong date. The measurement artefact above.
6. Managing mix by instinct while managing price by system. Half the operation on data and half on recollection produces results nobody can attribute.
What should you measure?
| Metric | How to compute | Which decision it tests |
|---|---|---|
| Aging distribution, by band | Share of units in each band | Which decision is failing |
| Days to first enquiry | Listing date → first lead on that unit | Listing quality, decision 3 |
| Days to sale from acquisition | Not from front line | The whole system |
| Gross by days-in-stock band | Average gross, per band | What the tail actually costs |
| Aging by segment | Split | Stocking, decision 1 |
| Appraised vs realised | Per unit, over time | Acquisition, decision 2 |
Row two is the most diagnostic and the least measured. A unit with no enquiries in its first two weeks has a visibility problem, not a price problem, and discounting it is the wrong response to the evidence.
Row four is the one that funds the work: knowing what a 60-day unit grosses against a 20-day unit converts an abstract preference for turn into a number the whole store can act on.
Frequently asked questions
How should used car inventory be managed as a system?
As four decisions in order: what to stock, what to pay, how to list it, and when to move it. Each constrains the ones after it, so a unit bought wrong can only be managed rather than fixed. Most stores spend their attention on the last decision, which has the least room left in it.
Where does AI help most in used car inventory?
In repricing and aging alerts, which is the decision with the least leverage but the one nobody can do well by hand past about 150 units. It also helps substantially with listing quality. Stocking and appraisal benefit moderately, limited by the thinness of any single store's own data.
What does an aging profile tell you?
Which decision is failing. A thin fresh band with a long tail points at stocking or acquisition price rather than repricing. A healthy fresh band with a thick middle points at repricing cadence. Units with no enquiries at all point at listing quality rather than price.
Is discounting aged units the right response?
It clears the symptom. If the units were slow from day one, the cause is upstream — stocking or acquisition price — and the shape of the aging profile will return next quarter. The diagnostic is whether those units ever generated enquiries, which is answered by days-to-first-enquiry.
Why does days-in-stock get measured incorrectly?
Because many systems count from the front-line date rather than the acquisition date, which excludes recon time. That understates aging by exactly the period most worth measuring and makes every downstream pricing and stocking decision look better than it is.
What is days to first enquiry and why does it matter?
The time between listing a unit and the first lead on it. It separates a visibility problem from a price problem: a unit with no enquiries in two weeks is not being seen, and discounting it responds to the wrong evidence. It is the most diagnostic inventory metric and the least commonly tracked.
Should stocking decisions follow regional market data?
Partly. Regional averages describe a market your store only partly serves, and include competitors whose customers are not yours. Your own sold results are a thinner but more relevant sample, and the useful approach blends them rather than deferring entirely to either.
How do you connect aging back to buying?
By reporting aging split by segment and by buyer, and by routing that back to whoever acquires. Without the loop, the system flags aged units forever and nobody changes what is being bought, which means the same pattern reappears every quarter.
Conclusion
- Four decisions, in order, and each constrains the next. Aging usually starts two steps earlier.
- AI is strongest at decision four, which has the least leverage. That explains the smaller-than-expected gains.
- Read the shape, not the total. A thin fresh band means the problem is upstream.
- Days to first enquiry separates visibility from price. Almost nobody measures it.
- Count days from acquisition. Front-line dating hides recon inside the aging number.
Last updated: