Stocking models are built on regional market data because that is the data that exists at scale. Your store does not sell to the region — it sells to a subset with its own preferences, and the difference between those two populations is where stocking decisions quietly go wrong.
This guide covers why regional data misleads, how to weight your own sample, what to stock on, where stocking models fail, and what to measure.
Why does regional data mislead?
Because it averages across stores whose customers are not yours.
A regional demand figure for compact SUVs includes a franchise store on the highway, a luxury dealer, three independents in a different income bracket and an auction-heavy wholesaler. Your store serves a slice of that, defined by your location, your price band, your financing mix and your reputation.
The regional number is the right answer to the question "what sells in this region." It is the wrong answer to "what sells at my store," and stocking tools frequently do not distinguish.
Where the two disagree
Illustrative. Run this on your own sold units against whatever regional data your tool uses.
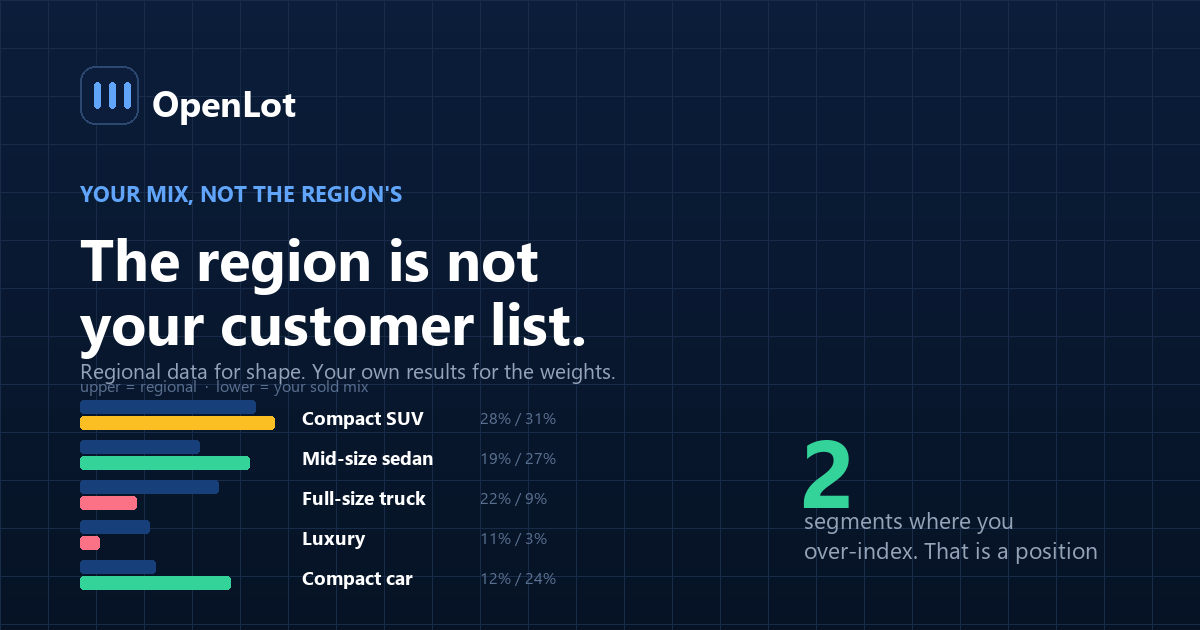
Segment Regional share Your sold share Read Compact SUV 28% 31% Aligned Mid-size sedan 19% 27% You over-index. Buy more Full-size truck 22% 9% You do not serve this buyer Luxury, any 11% 3% Not your customer Compact car 12% 24% You over-index Other 8% 6% — A model stocking to the regional column buys trucks you cannot retail and under-buys the sedans and compacts you actually sell.
The rows where you over-index are the useful finding. They usually reflect something true about your location, your price band or your financing mix — and they are a competitive position rather than an accident.
How do you weight a thin sample?
Your own data is more relevant and much thinner. A store selling 50 units a month has 600 observations a year, spread across segments, trims and seasons. That is not enough to model on alone, and it is too important to ignore.
Three practical approaches:
1. Use regional data for the shape, your own for the weights. Let market data tell you what is moving and in which direction; let your own results decide how much of each to hold.
2. Pool at the segment level, not the trim level. You have enough data to say "mid-size sedans sell well here" and not enough to say "this specific trim in this colour." Make the decision at the level your sample supports.
3. Widen the window where volume is low. Twenty-four months of your own data beats twelve for a 50-car lot, with the caveat that anything beyond two years is describing a different market.
The one thing not to do is to stock to the regional number because it has more observations behind it. More data about the wrong population is not better data.
What should stocking decisions actually be made on?
Four inputs, roughly in order of weight for a small independent:
1. Your own days-to-sale by segment. The most relevant number you have, and it combines demand and your own pricing position in one figure — the basis of turn rate.
2. Your own gross by segment. Fast-turning units with no margin are a different problem from slow units with good margin, and a turn-only target picks the wrong one.
3. Your aged inventory by segment. The segments producing your tail are telling you something, and the feedback loop to acquisition is where most stores break the chain.
4. Regional demand and supply. Useful for direction and for spotting what is about to become scarce, and it should not be the primary weight.
A store that stocks on 1 through 3 and uses 4 as a sense-check is using data correctly. One that stocks on 4 alone is buying for someone else's customers.
Where do stocking models fail?
1. Regional averages as the primary input. The whole subject above.
2. Turn without gross. Optimising days-to-sale alone leads to stocking the fastest-turning, lowest-margin units in the market.
3. Ignoring what you can actually source. A model recommending units you cannot buy at a price that works is producing a wish list — the sourcing reality covered in acquisition strategy.
4. No connection to aging. The segments producing aged units should be reflected in the next stocking decision, and usually are not.
5. Seasonality fitted on too little data. A 50-car lot does not have enough observations to fit a seasonal curve by segment. Use regional seasonality for that specifically — it is the one place the broad data is clearly better.
6. Treating the recommendation as a plan. A stocking model produces a target mix. What you can buy this week at auction is a different question, and the gap between the two is where a buyer earns their value — and where wholesale exits tell you which segments keep failing.
What should you measure?
| Metric | How to compute | What it decides |
|---|---|---|
| Sold mix by segment | Your units, 24 months | The weights |
| Days to sale by segment | From acquisition | Demand and pricing position, combined |
| Gross by segment | Average, per segment | What turn alone would hide |
| Aged units by segment | Share of your tail | What to stop buying |
| Your mix vs regional mix | Side by side | Where you over- and under-index |
| Target mix vs acquired mix | Planned against bought | Whether the plan survives the auction |
Row five is the one-page analysis that changes stocking conversations. It takes an afternoon, needs no vendor, and the segments where you over-index are usually a competitive position worth defending rather than a deviation to correct.
Row six is the honest check on the whole exercise. A target mix nobody can buy is a document, and if acquired mix diverges from target every month, either the target is wrong or the sourcing is.
Frequently asked questions
Why is regional demand data a poor basis for stocking?
Because it averages across stores whose customers are not yours — different price bands, locations, financing mixes and reputations. It correctly answers what sells in the region and incorrectly answers what sells at your store, and stocking tools frequently do not make the distinction.
Is my own sales data too thin to stock on?
Thin, and more relevant. A 50-car lot generates a few hundred observations a year, which is not enough to model trims or fit seasonal curves, but is enough to set segment-level weights. The practical approach is regional data for direction and your own results for weights.
What should stocking decisions be based on?
Your own days-to-sale by segment, your own gross by segment, the segments producing your aged inventory, and regional demand as a sense-check. The first three are the most relevant data you have, and the fourth is best used for direction rather than as the primary weight.
What if my mix differs a lot from the regional mix?
That is usually a finding rather than an error. Segments where you over-index typically reflect something true about your location, price band or financing mix, and they represent a competitive position. Correcting toward the regional average is frequently the wrong response.
Should seasonality come from my own data or regional data?
Regional, for this specifically. A small store does not have enough observations to fit a seasonal curve by segment, and seasonality is the one area where the broader sample is clearly better. Use it for timing, not for mix weights.
Why is turn-only stocking a mistake?
Because it selects the fastest-moving, lowest-margin units in the market. Days to sale and gross by segment have to be read together, otherwise the model optimises a number that looks like efficiency and produces less money.
How does aged inventory feed back into stocking?
The segments producing your tail should change what gets bought, and in most stores the loop is never closed. Reporting aged units split by acquisition segment and routing it to whoever buys is a small change that prevents the same pattern recurring every quarter.
What is the difference between a target mix and a stocking plan?
A target mix is what you want to hold. What is available at auction this week at a price that works is a separate question, and the gap between them is where a buyer adds value. Tracking acquired mix against target tells you whether the target is realistic or the sourcing needs attention.
Conclusion
- Regional data describes a population you only partly serve. More data about the wrong people is not better.
- Regional for shape, your own for weights. Decide at the level your sample supports.
- Turn and gross together. Turn alone stocks the fastest, thinnest units in the market.
- Seasonality is the exception — use the broad sample there.
- Compare your mix to the regional mix once. Where you over-index is usually a position, not an error.
Last updated: