A dealership AI ROI model is a funnel with four conversion stages and an honest estimate of which one the software moves. Build it before the demo, not during one. A model you assembled from your own numbers turns a vendor presentation into a test of their claim rather than a presentation of it.
This guide covers the four-stage funnel every AI ROI case runs through, how to populate it from your own data, which stage each category of product actually moves, the five errors that inflate every vendor case, and what to measure after deployment.
Why build the model before the demo?
Because a vendor ROI calculator is a correct piece of arithmetic wrapped around an assumption you did not get to choose.
The arithmetic is usually fine. The assumption — that their product lifts one specific conversion rate by a specific amount, and that nothing else in the funnel changes — is the entire claim, and it arrives pre-loaded in a tool you cannot audit under time pressure in a meeting.
If you walk in with your own funnel already populated, the conversation changes shape. You are no longer evaluating their model. You are asking them to name which stage they move and by how much, and then you put their number into your model.
What are the four stages?
Every dealership AI ROI case, regardless of category, reduces to a lift at one of four conversions.
| Stage | Conversion | Typical product that claims it |
|---|---|---|
| 1. Lead → contact | Did you reach a two-way conversation? | Lead response, AI BDC, voice AI, SMS |
| 2. Contact → appointment | Did they agree to come in? | Appointment setters, chat qualification |
| 3. Appointment → show | Did they actually arrive? | Confirmation and reminder automation |
| 4. Show → sold | Did they buy? | Almost nothing — this is the sales floor |
The fourth row matters. Very little software moves show-to-sold, and a vendor case that leans on it is making a claim about your sales process rather than about their product.
The propagation arithmetic
Illustrative. Substitute your own four rates and your own gross.
A store taking 1,000 internet leads a month, with:
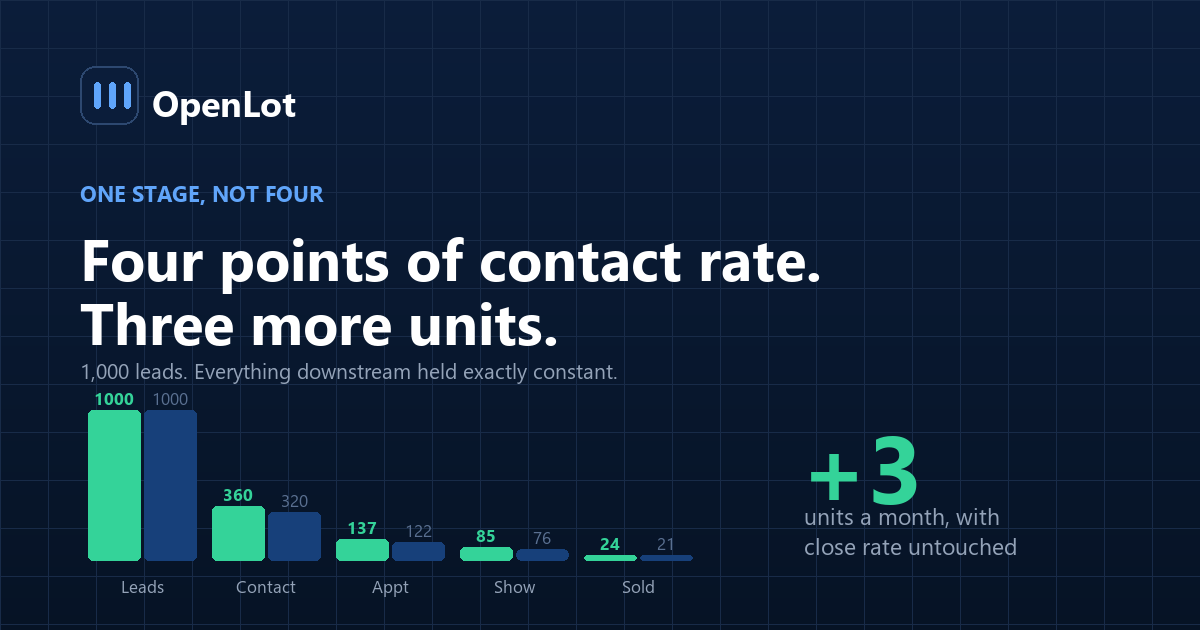
Stage Rate Volume Leads — 1,000 Contact rate 32% 320 Appointment rate 38% 122 Show rate 62% 76 Close rate 28% 21 units Now move contact rate alone from 32% to 36% — four points, which is a realistic claim for closing a genuine after-hours coverage gap — and hold everything downstream constant:
1,000 → 360 → 137 → 85 → 24 units. A gain of 3 units a month.
At $2,400 average front and back gross, that is $7,200 a month against a system costing $1,200 — though $1,200 is the quote rather than the cost. The case works anyway, and notice it never needed the close rate to move.
Now run it at a 1-point lift instead of 4. The gain is under one unit, and the case fails. The lift assumption is the whole model.
How do you populate it from your own data?
Four queries, all available in any CRM, all worth computing yourself rather than accepting a dashboard number.
Contact rate. Leads that reached a genuine two-way exchange, divided by total leads. Not leads that received an auto-responder. The distinction matters because most stores report the auto-responder figure, which is why self-reported numbers run optimistic — the gap is visible in the contact rate problem.
Appointment rate. Appointments set, divided by contacts. Count the appointment at the moment it was agreed, not at confirmation, or you have blended stages two and three.
Show rate. Appointments attended, divided by appointments set. This is the number most commonly unavailable, and its absence is itself a finding.
Close rate. Units sold from internet leads, divided by shows. Keep internet-sourced deals separate from walk-ins or the figure means nothing.
Also pull the denominators by day-part, because that is where any lead-response case lives. A four-point contact rate lift concentrated in the 59% of the week nobody covers is a different claim than four points spread evenly.
Which stage does each product actually move?
| Product category | Honest claim | Inflated claim |
|---|---|---|
| AI lead response / BDC | Contact rate, concentrated in uncovered hours | Close rate, through "better engagement" |
| Appointment setter | Appointment rate, and show rate via confirmations | Units sold |
| Chat / chatbot | Contact rate on site traffic | Appointment rate, unless it books against a real calendar |
| Voice AI | Contact rate on inbound calls; abandonment | Gross per unit |
| Service scheduling | Appointment rate in fixed ops | Sales conversion through equity mining |
| Inventory / pricing AI | Days to sale, not a funnel stage at all | Anything in this funnel |
The last row is a category error worth naming: inventory and pricing tools act on turn and margin, not on lead conversion, and a case that drops them into the lead funnel is modelling the wrong thing entirely.
Where do ROI cases go wrong?
1. Lifting more than one stage. A model that improves contact rate and appointment rate and close rate compounds three assumptions into a number nobody can defend. One stage. Name it.
2. Counting bookings instead of shows. The most flattering failure mode in the category. A system that books 40% more appointments that 30% fewer people attend has produced activity, not revenue — which is why show rate, not booking rate, is the number that matters.
3. Ignoring the handoff constraint. If engaged conversations queue for hours because nobody is free to take them, the front-of-funnel lift does not propagate. The model assumes capacity that does not exist.
4. Using gross instead of contribution. Front and back gross is not what the incremental unit contributes once you subtract variable selling cost. Using gross overstates every case by whatever that gap is at your store — the same measurement problem behind rising cost per sale.
5. No baseline. Without the four rates captured before go-live, the post-deployment number is unattributable, and every seasonal swing becomes an argument. This is why the baseline sits in week one of the implementation plan.
What should you measure after deployment?
| Metric | How to compute | What it proves |
|---|---|---|
| Contact rate, by day-part | Two-way conversations ÷ leads, bucketed by hour | Whether the lift landed where the case said it would |
| Show rate | Attended ÷ set | Whether extra bookings were real |
| Handoff pickup time | Escalation → first human reply | Whether the lift can propagate at all |
| Units from internet leads | Sourced deals, monthly, against baseline | The only number that settles the argument |
| Cost per incremental unit | Total system cost ÷ units above baseline | Whether the case survived contact with reality |
Run these monthly against the baseline for at least a quarter. One month of improvement is seasonality; three is a result.
Frequently asked questions
How do I calculate ROI for dealership AI?
Build a four-stage funnel from your own data — lead to contact, contact to appointment, appointment to show, show to sold — then apply the vendor's claimed lift to the single stage their product touches and hold the rest constant. Multiply the incremental units by contribution per unit rather than gross, and compare that against the full cost of the system including integration and internal hours.
Which conversion stage does AI actually improve?
In almost every case, lead-to-contact, and concentrated in the hours nobody is staffed. Appointment setters also move appointment rate and, through confirmation sequences, show rate. Very little software moves show-to-sold, so a case that depends on close rate improving is making a claim about your sales floor rather than about the product.
What is a realistic contact rate lift from AI lead response?
A few points, with the gain concentrated in uncovered hours rather than spread evenly across the week. The honest way to size it is to bucket your own leads by hour and weekday, see what share arrives outside staffed hours, and ask what fraction of those are currently reaching a two-way conversation at all — the lift available is bounded by that number.
Should I use gross or contribution per unit in the model?
Contribution. Front and back gross includes costs that scale with the incremental unit, so using it overstates the case by whatever that gap is at your store. If contribution per unit is not something you can produce readily, that is a finding worth acting on independently of any AI decision.
Why is booking rate a misleading metric?
Because bookings are easy to inflate and shows are not. A system that books substantially more appointments while show rate falls has generated activity rather than revenue, and the two effects can cancel entirely. Show rate is the first number to check when a deployment looks successful on the vendor dashboard.
How long should I measure before deciding the deployment worked?
At least a quarter, measured against a baseline captured before go-live. One month of improvement is indistinguishable from seasonality in retail automotive, and three months with consistent movement in the specific stage the case named is the minimum standard for attributing the result to the system.
What if we never captured a baseline?
Then the result is unattributable and every discussion about it becomes an argument about seasonality. The partial recovery is to pull historical CRM data for the same stages over the prior year, which gives you a seasonal comparison rather than a clean baseline — weaker, but better than nothing. Capture the baseline properly before the next deployment.
Can a vendor ROI calculator be trusted?
The arithmetic usually can; the assumption inside it usually cannot be audited in a meeting. The useful approach is to build your own funnel from your own numbers first, then ask the vendor to name which single stage they move and by how much, and put that figure into your model instead of theirs.
Conclusion
- Build the model before the demo. It converts a presentation into a test of one specific claim.
- Four stages, one lift. A case that moves more than one conversion rate is compounding assumptions nobody can defend.
- Shows, not bookings. The most flattering failure in the category is more appointments that fewer people attend.
- Contribution, not gross. Gross overstates every case by the variable selling cost of the incremental unit.
- No baseline, no attribution. Capture the four rates before go-live, because they cannot be reconstructed later.
Last updated: