When dealership cost per sale rises while unit volume stays flat, the instinct is that leads got more expensive. Sometimes true. More often, the leads are fine and fewer of them are converting — and adding budget to a conversion problem is the most expensive way to not fix it.
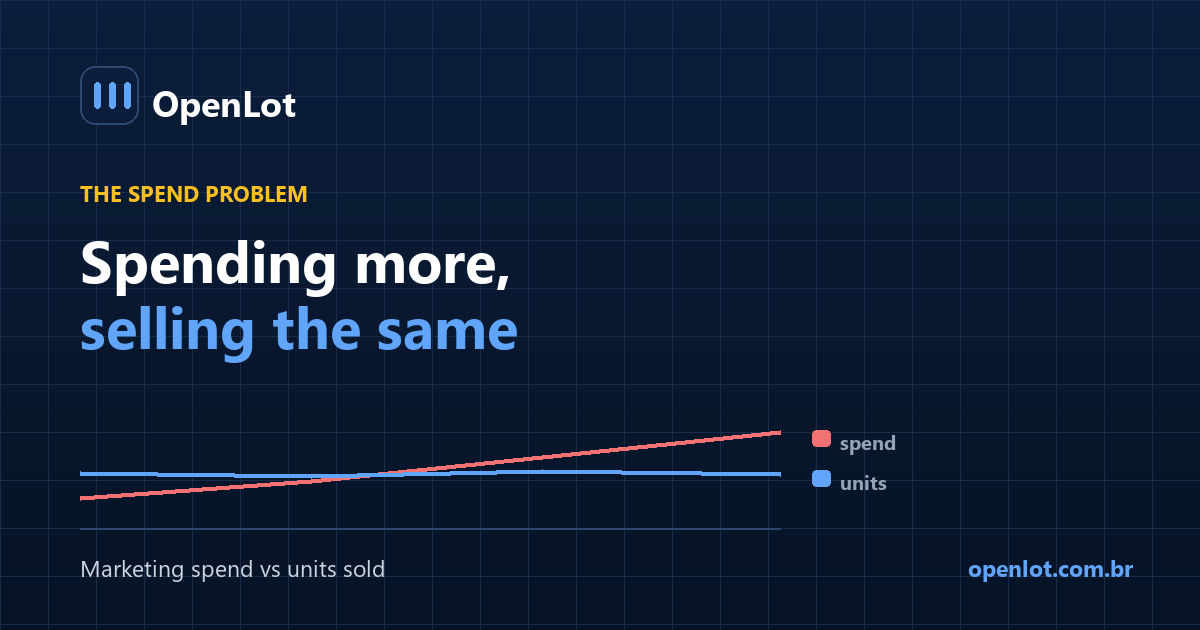
This guide covers how to tell a traffic problem from a conversion problem, where the leaks usually are, and what to do before increasing budget.
Is it a traffic problem or a conversion problem?
This is the whole question, and it is answerable in an afternoon.
Pull 24 months and compare two periods at each funnel stage:
| Stage | 12 months ago | Now | Direction |
|---|---|---|---|
| Marketing spend | |||
| Leads generated | |||
| Cost per lead | |||
| Leads contacted | |||
| Contact rate | |||
| Appointments set | |||
| Appointment rate | |||
| Appointments shown | |||
| Show rate | |||
| Units sold | |||
| Close rate |
The four bolded rates are the diagnosis:
- Rates stable, cost per lead up → genuine traffic cost inflation. Spend is the lever.
- Cost per lead stable, rates down → conversion problem. More budget makes it worse.
- Both → common, and the conversion side is almost always cheaper to fix first.
Most stores that have never run this find the second pattern and have been treating it as the first.
Why adding budget to a conversion leak backfires
Illustrative. Run yours.
A store spends $40,000 and sells 80 units → $500 per sale.
Contact rate quietly drops from 45% to 32% — a phone or staffing change nobody connected to sales. Volume falls to 68 units. Cost per sale rises to $588.
The store responds by adding 25% more budget: $50,000.
- Leads rise proportionally
- Contact rate is still 32%, so the same share leaks out
- Units reach roughly 85 — up from 68
- Cost per sale: $588. Unchanged.
They spent $10,000 more per month and moved cost per sale by nothing, because the leak scales with the volume flowing through it.
Restoring contact rate to 45% at the original $40,000 would have produced ~80 units at $500 — better volume economics than the larger budget delivered.
The general rule: a percentage leak cannot be outspent. More volume through the same leak produces proportionally more loss.
Where the leaks usually are
In the order worth checking.
1. Response time drifted
The most common and least noticed. A BDC agent left, a shift changed, a lead routing rule broke. Response time moves from four minutes to forty, and nothing in any report announces it — but qualification rates fall across every source at once.
Tell: conversion drops on all sources simultaneously. Source-specific problems do not do that.
2. Contact rate is falling
Numbers flagged as spam, cadence shifted toward calls the customer will not answer, list decay. This degrades gradually, which is why it is usually attributed to lead quality.
Tell: attempts per contact rising over months on stable sources.
3. Sources overlap more than they used to
Adding channels does not always add reach. A new campaign can serve the same in-market shoppers you were already reaching, converting customers who would have arrived anyway through a cheaper path.
Tell: total spend up, total leads up, but unique customers roughly flat. This requires deduplication to see at all.
4. Duplicates inflated the denominator
If lead records grew faster than actual humans, your cost per lead looks better and your close rate looks worse than reality. Both readings push toward the wrong decision.
Tell: duplicate rate rising between periods.
5. Inventory stopped matching demand
The leads convert worse because you do not have what they are asking for. This is not a marketing problem at all, though it presents as one.
Tell: appointment rate holds, show rate holds, close rate falls — and aged inventory is climbing at the same time.
6. The sales floor changed
Turnover, a manager change, more new people on the floor. Show-to-sold falls while everything upstream is stable.
Tell: the leak is entirely in the last stage.
What to do before increasing budget
1. Run the two-period funnel comparison. Two hours of work, and it locates the stage that moved. Skipping this is how stores spend a year adding budget to a broken stage.
2. Deduplicate before comparing anything. If duplication changed between the periods, every rate comparison is contaminated.
3. Fix stages in order, not simultaneously. Response time first — it is upstream of everything and usually the cheapest. Then contact rate, then appointment and show, then the floor. Changing four things at once means learning nothing.
4. Measure cost per sale by source, not blended. A blended number moving tells you something changed; a per-source breakdown tells you what. Sources rarely move together.
5. Check whether your new source is incremental. Deduplicate across sources and compare unique customers, not lead counts. A channel that adds leads without adding unique in-market shoppers is repackaging traffic you already had.
6. Set an alert on response time. Since response drift is the most common cause and the least visible, it deserves monitoring rather than quarterly discovery.
The order matters
Upstream fixes multiply downstream. Restoring response time raises contact rate, which raises appointments, which raises units — through the same spend. Fixing the sales floor while response time is broken improves the conversion of a smaller pool.
This is also why conversion fixes usually beat budget increases on cost: a percentage improvement applies to every lead you already buy, while additional budget only buys more leads at the current rate.
Frequently asked questions
Why is my dealership cost per sale going up?
Either leads genuinely cost more, or fewer leads are converting. Compare contact rate, appointment rate, show rate and close rate between two periods. If the rates fell, it is conversion, and additional budget will not improve cost per sale.
Should I increase marketing spend if sales are flat?
Not until you know whether conversion rates held. If a rate dropped, more budget produces proportionally more leakage at the same cost per sale. Fix the rate first; the improvement then applies to the leads you already buy.
How do I know if a new marketing source is incremental?
Deduplicate customers across all sources and compare unique in-market shoppers, not lead counts. If total leads rose but unique customers did not, the new source is serving people you were already reaching.
What is the most common cause of falling dealership conversion?
Response time drift — a staffing or routing change that pushes first contact from minutes to hours. It is the most common because nothing reports it, and it shows up as conversion falling across every source at once.
Should I measure cost per sale blended or by source?
By source. A blended figure tells you something moved without telling you what, and sources rarely move together. Blended is for the board; per-source is for decisions.
How often should a dealership review cost per sale?
Monthly by source, with the full funnel comparison quarterly. Response time deserves more frequent monitoring, ideally an alert, since it is the fastest-moving and most consequential input.
My cost per lead is fine but cost per sale is rising. What does that mean?
That your leads cost what they always did and fewer of them are converting. The problem is downstream of marketing, somewhere between lead received and unit sold, and the funnel comparison will locate which stage.
Conclusion
- Separate traffic cost from conversion before changing any budget. The two-period funnel comparison answers it.
- A percentage leak cannot be outspent. More volume through the same leak scales the loss proportionally.
- Response time drift is the usual suspect. It moves all sources at once and reports itself nowhere.
- Deduplicate first. Duplication changes contaminate every rate you are comparing.
- Fix upstream first. Response time improvements multiply through every downstream stage.
Build the two-column funnel comparison this week. If the rates moved, the answer is not in the media plan.
Last updated: