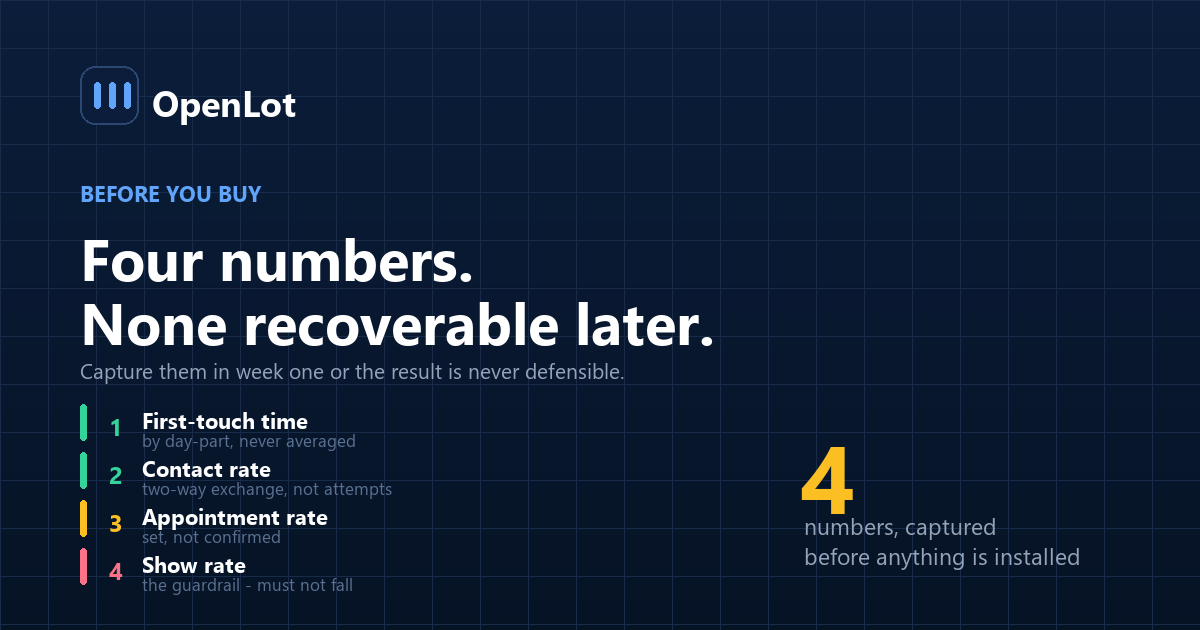
AI lead response is software that answers internet leads without a person initiating each touch. Whether it worked is settled by four numbers — first-touch time, contact rate, appointment rate and show rate — and all four have to be captured before anything is installed, because none of them can be reconstructed afterwards.
This guide covers the four numbers that decide the result, how to compute each one honestly, the definitions vendors change, where measurement goes wrong, and what the numbers should look like after deployment.
Why does the baseline matter more than the product?
Because without it, every post-deployment conversation becomes an argument about seasonality.
A store that installs a system in March and sells more in April has learned nothing. April is not March. The only way to attribute a change to the system is to have measured the same four numbers, computed the same way, before it existed.
And the baseline cannot be recovered. First-touch time by day-part can sometimes be reconstructed from timestamps if the CRM retained them, but contact rate and show rate generally cannot, because the definitions change the moment someone is motivated by the answer.
Capture them in week one. This is why it sits at the front of the 30-day implementation plan.
What are the four numbers?
| # | Metric | Definition | What AI should move |
|---|---|---|---|
| 1 | First-touch time, by day-part | Lead timestamp → first genuine outbound, bucketed by hour and weekday | Collapses to seconds in uncovered hours |
| 2 | Contact rate | Leads reaching a two-way exchange ÷ total leads | Rises, concentrated in the gap |
| 3 | Appointment rate | Appointments set ÷ contacts | Flat to slightly up — this is not where AI wins |
| 4 | Show rate | Appointments attended ÷ appointments set | Must not fall |
The fourth is a guardrail rather than a target. A system that books substantially more appointments while show rate drops has converted your pipeline into activity.
1. First-touch time, by day-part
Not an average. The average is the single most misleading number in this category, because it blends a 90-second Tuesday reply with a 38-hour Sunday wait and reports something that describes neither.
Bucket by hour of day and day of week. The picture you want is a grid where the uncovered blocks are visibly different from the staffed ones — that is the shape of the opportunity, and a flat average hides it completely.
The trap: measuring to the auto-responder. An automated "thanks, we got your request" is not a first touch, and counting it produces a number three orders of magnitude better than reality. Measure to the first message that references the customer, the vehicle or the question.
2. Contact rate
Leads that reached a genuine two-way exchange, divided by total leads. The customer replied, or picked up, and something was exchanged.
This is the number AI actually moves — and almost all of the movement lands in the hours nobody covers. It is also the one most commonly overstated internally — the gap between reported and real is the subject of why dealership leads never answer.
The trap: counting outbound attempts as contacts. A rep who called eight times and never spoke to anyone has made eight attempts and zero contacts. Activity logging frequently cannot tell the difference, which is why this number has to be computed deliberately rather than pulled from a dashboard.
3. Appointment rate
Appointments set, divided by contacts. Count the appointment at the moment it was agreed, not when it was confirmed.
Expect this one to stay roughly flat. AI gets more people into a conversation — largely by executing the follow-up cadence rather than by being persuasive. It does not make a given conversation more convincing. A vendor case built on a large appointment-rate lift is making a claim about conversation quality that is hard to support.
The trap: counting at confirmation. That blends stages three and four and makes both numbers meaningless.
4. Show rate
Appointments attended, divided by appointments set. The number most commonly unavailable in a dealership, and its absence is itself a finding.
If nobody records whether a booked customer arrived, the store cannot tell a good appointment from a bad one, and no automation decision can be evaluated.
The trap: a shrinking denominator. If "appointment" quietly comes to mean "firm appointment" after deployment, show rate improves without anything changing. Freeze the definitions in writing at baseline.
Why the split by day-part is the whole exercise
Illustrative. The shape is the point.
A store with a 41-minute average first-touch time looks mediocre and fixable. Split it:
Window Share of leads First touch Staffed hours 44% 9 minutes Evenings 31% 6 hours Overnight 11% 11 hours Sunday 14% 19 hours The average of these is meaningless and the distribution is actionable. Staffed hours are fine. More than half the leads sit in windows measured in hours, and that is where every available point of contact rate lives.
Run your own. The grid, not the average.
Where does the measurement go wrong?
1. Pulling the numbers from a vendor dashboard. The definitions are theirs, and they are frequently the flattering ones. Compute from raw CRM exports.
2. Averaging across day-parts. Covered above and worth repeating, because it is the single most common error and it hides the entire opportunity.
3. Blending lead sources. A third-party marketplace lead and a website form lead behave differently at every stage, and a blended rate describes neither — the problem underlying lead attribution.
4. Measuring a month. One month is seasonality. Use 90 days, and keep the same window for the comparison.
5. Leaving show rate out because it is hard. It is the guardrail. Without it, the most flattering failure mode in the category is invisible.
What should the numbers look like afterwards?
| Metric | Expected movement | If it does not move |
|---|---|---|
| First-touch, uncovered hours | Seconds, from hours | Integration is batch, or routing is wrong |
| First-touch, staffed hours | Largely unchanged | Normal — a person was already answering |
| Contact rate, in-gap | Up, visibly | Leads are reachable but the messages are not landing |
| Contact rate, in-hours | Roughly flat | Normal |
| Appointment rate | Flat to slightly up | Normal |
| Show rate | Flat or better | Falling means you bought activity |
The second row surprises people. A system that does not improve first-touch time during staffed hours is not underperforming — those hours already had a human on them, and the gain was always going to be concentrated where nobody was.
Compare at 30, 60 and 90 days against the same 90-day baseline window. One month of improvement is not a result.
Frequently asked questions
What should a dealership measure before buying AI lead response?
Four numbers: first-touch time bucketed by hour and weekday, contact rate, appointment rate and show rate. All four need to be computed from raw CRM data over a 90-day window with the definitions written down, because the comparison afterwards is only valid if the definitions did not move.
How do you measure lead response time correctly?
Measure from the lead timestamp to the first genuine outbound message — one that references the customer, the vehicle or the question — not to an automated acknowledgement. Then bucket the result by hour of day and day of week rather than averaging, because a single average blends a nine-minute weekday reply with a nineteen-hour Sunday wait and describes neither.
What is a good contact rate for internet leads?
Less useful than knowing your own, split by source and by day-part. Blended industry figures mix third-party marketplace leads with website form submissions, which behave differently at every stage. The actionable comparison is your in-gap contact rate against your in-hours contact rate, because the difference is the size of the opportunity.
Why does show rate matter more than appointment count?
Because appointment count is easy to inflate and attendance is not. A system that books substantially more appointments while show rate falls has generated activity rather than revenue, and the two effects can cancel completely. Show rate is the guardrail that makes an apparent success verifiable.
Should appointment rate improve after deploying AI?
Only slightly, if at all. AI moves people into conversations; it does not make a given conversation more persuasive. A vendor case resting on a large appointment-rate lift is making a claim about conversation quality rather than about coverage, and that claim is much harder to support.
Can we reconstruct a baseline after deployment?
Partially, and weakly. First-touch time can sometimes be rebuilt from retained timestamps, but contact rate and show rate usually cannot, because those definitions depend on how activity was logged and people start logging differently once they are being measured. The practical fallback is comparing against the same period last year, which controls for seasonality but not for anything else.
How long should the baseline window be?
Ninety days, and the post-deployment comparison should use a matching ninety-day window. Thirty days is indistinguishable from seasonality in retail automotive, and a comparison between a 30-day baseline and a 90-day result is not a comparison at all.
Why not just use the vendor dashboard numbers?
Because the definitions belong to the vendor and tend to be the flattering ones — counting an auto-responder as a first touch, or an outbound attempt as a contact. Computing from raw CRM exports with your own written definitions is the only way to ensure the before and after numbers mean the same thing.
Conclusion
- Four numbers, captured before anything is installed. They cannot be reconstructed later.
- Bucket by day-part, never average. The average hides the entire opportunity.
- Contact rate is the one AI moves. Appointment rate should stay roughly flat, and a case built on it is weak.
- Show rate is the guardrail. More bookings with worse attendance is activity, not revenue.
- Freeze the definitions in writing, and compare 90 days against 90 days.
Last updated: