Comparing an AI BDC to a staffed one on monthly cost compares two incomplete numbers. Built properly, both columns include items nobody puts in them — and the only comparison that survives is cost per appointment, which is a different ranking from cost per month.
This guide covers both columns in full, the per-appointment comparison, the three figures that change the answer, where the comparison goes wrong, and what to measure.
Column one: a staffed BDC, in full
| Item | Commonly counted? |
|---|---|
| Base wages | Yes |
| Payroll burden and benefits | Sometimes |
| Manager time supervising | Rarely |
| Turnover: recruiting, training, ramp | Rarely |
| Productivity lost during ramp | Almost never |
| CRM seats and phone licences | Sometimes |
| Workspace and equipment | Rarely |
The three middle rows are the ones that move the number. BDC turnover is high, each replacement costs recruiting plus several weeks of reduced output, and manager supervision is a real share of someone's week — the broader dynamic in why good people leave.
Column two: an AI BDC, in full
| Item | Commonly counted? |
|---|---|
| Platform licence | Yes |
| Integration and setup | Sometimes, and usually under-quoted |
| Internal hours: transcript review, tuning | Rarely |
| Escalation handling | Rarely — and it is a person |
| Data remediation before go-live | Rarely |
| Annual price escalation | Almost never |
The two bold rows are the ones that get left out, and together they are substantial. A deployment needs somebody reviewing output weekly and somebody taking escalations at peak — the escalation ratio that is almost never modelled.
The broader pattern is the one in the six costs the quote leaves out: both columns are quoted on the artifact rather than on the capability.
The comparison that works
Cost per appointment, not cost per month
Illustrative. Substitute your own figures.
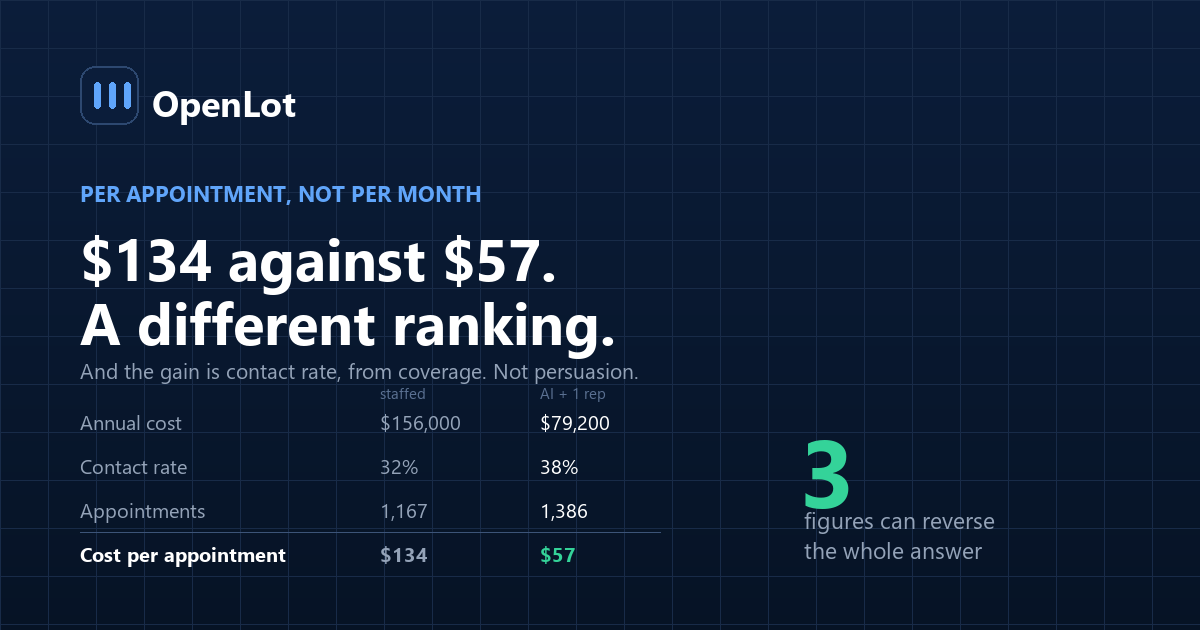
Staffed BDC (3) AI + 1 rep Annual cost, fully built $156,000 $79,200 Leads handled per year 9,600 9,600 Contact rate 32% 38% Appointment rate 38% 38% Appointments 1,167 1,386 Cost per appointment $134 $57 The contact-rate row is where the gain comes from, and it comes from coverage rather than from quality — more leads reached because somebody answered at 11pm. Appointment rate is held constant deliberately, because that is the honest assumption.
Run it with your own contact rate. If your current coverage is already good, that row barely moves and the comparison narrows considerably.
The three figures that change the answer
1. Share of leads arriving outside staffed hours. The larger it is, the more the contact-rate row moves. This is the single most decisive input and it is a one-query measurement.
2. Current contact rate. A store already at a high contact rate has less headroom, and the case weakens accordingly.
3. Escalation volume. It determines how many people stay. A store with high escalation volume keeps two, and the cost column changes shape.
Everything else — licence price, wage levels, integration quotes — moves the number without changing the ranking. These three can reverse it.
Where does the comparison go wrong?
1. Wages only on the left. Understates the staffed column by a third or more.
2. Licence only on the right. Understates the automation column, frequently by more.
3. Assuming appointment rate improves. It should not, and a case that assumes it is claiming the system is more persuasive than a person.
4. Zero people on the right. Covered in can you replace your BDC — the version with nobody does not work.
5. Comparing month one. Integration and tuning make the first quarter unrepresentative in both directions.
6. Per month rather than per appointment. The ranking changes, and per appointment is the one that corresponds to the business.
What should you measure?
| Metric | How to compute | Which column it corrects |
|---|---|---|
| Fully loaded BDC cost | Wages + burden + manager time + turnover + seats | Left |
| Turnover cost per departure | Recruiting + training + ramp productivity | Left, the hidden part |
| Internal hours on AI oversight | Logged honestly for a month | Right, the hidden part |
| Escalations per peak hour | Volume × escalation rate | Right, the staffing requirement |
| Leads outside staffed hours | Bucketed by hour | The decisive input |
| Cost per appointment | Total cost ÷ appointments | The comparison itself |
Row five first. If a small share of leads arrives outside staffed hours, the main source of gain is absent and the rest of the exercise is less interesting than it looks.
Frequently asked questions
What does a staffed dealership BDC actually cost?
More than wages. A complete figure includes payroll burden, manager supervision time, turnover cost including recruiting and ramp, lost productivity during ramp, CRM and phone licences, and workspace. The middle items are routinely omitted and they move the number substantially.
What does an AI BDC actually cost?
More than the licence. Integration and setup, internal hours for transcript review and tuning, escalation handling which is a person, data remediation before go-live, and annual price escalation. The escalation handling line is the one most often left at zero and it is not zero.
How should the two be compared?
On cost per appointment rather than cost per month. The per-month comparison ranks the columns differently from the per-appointment one, and only the second corresponds to what the business actually gets from either option.
Where does the gain come from in the AI column?
Contact rate, driven by coverage rather than by better conversations. More leads reached because something answered at eleven at night. Appointment rate should be held constant in any honest model, because assuming it improves is claiming the system is more persuasive than a person.
Which measurement decides the comparison?
The share of leads arriving outside staffed hours. It drives the contact-rate improvement that produces the entire gain, and a store where that share is small has much less to gain regardless of what the licence costs.
Does the comparison assume nobody is retained?
It should not. A deployment with no people produces conversations that die in a queue, so the realistic right-hand column includes at least one person for engaged conversations and escalations. The zero-person version saves more and reverses within a year.
Why is month one a bad comparison point?
Because integration, tuning and the learning curve make the first quarter unrepresentative on both sides. Costs are front-loaded and gains are back-loaded, which makes an early comparison pessimistic and a very late one potentially flattering.
What changes if our contact rate is already high?
The case narrows considerably. The gain in the model comes from reaching leads nobody was reaching, so a store already contacting a high share of its leads is buying consistency and logging rather than coverage, which is a smaller and more modest argument.
Conclusion
- Both columns are quoted incomplete. Wages on one side, licence on the other.
- Compare cost per appointment, which ranks differently from cost per month.
- The gain is contact rate, from coverage. Hold appointment rate constant or the model is dishonest.
- Three figures can reverse the answer: out-of-hours share, current contact rate, escalation volume.
- Measure the out-of-hours share first. If it is small, the rest matters less.
Last updated: