Price forecasting in used cars is useful over a short horizon and unreliable over a long one, which sounds obvious and is routinely ignored in practice. The reliable window is weeks rather than quarters — and the decisions a forecast can support change completely depending on which side of that line they sit.
This guide covers how reliability decays with horizon, which decisions each window supports, what breaks a forecast, how to use an unreliable one, and what to measure.
How does reliability decay?
Not smoothly. It falls off at the points where something structural can change.
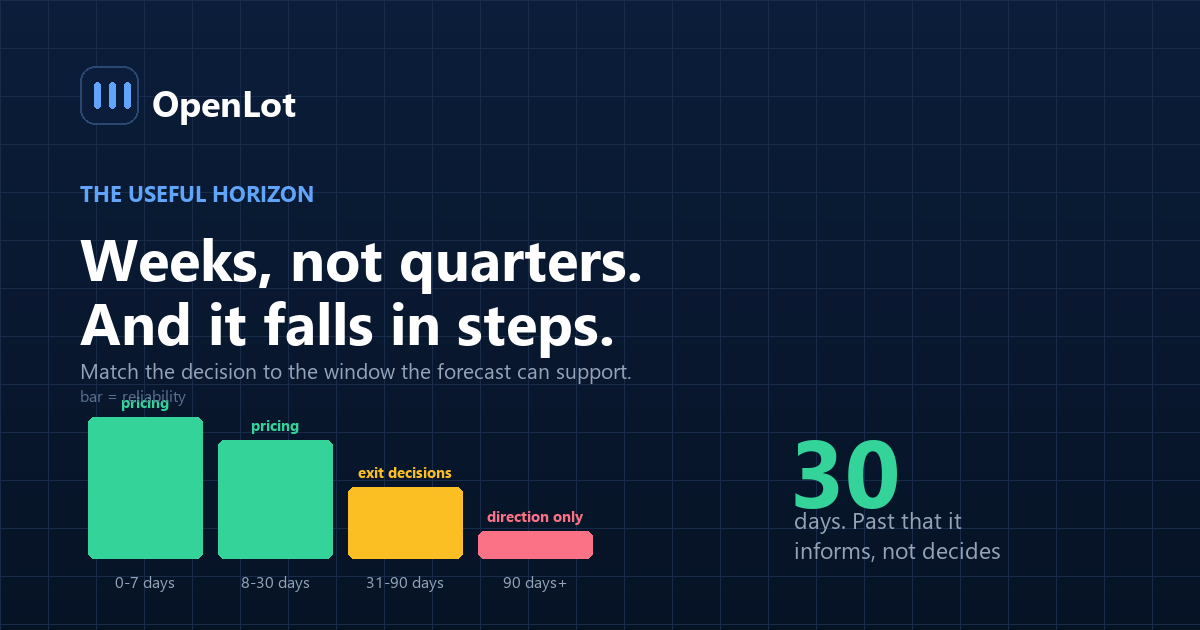
| Horizon | Reliability | What can change |
|---|---|---|
| 0–7 days | High | Essentially nothing structural |
| 8–30 days | Good | Local supply, a competitor's inventory |
| 31–90 days | Moderate | Seasonality, auction supply, rate movements |
| 90 days+ | Low | New-car supply, incentives, macro conditions |
The useful heuristic: a used car price forecast is reliable over the period in which the supply of substitutes is roughly fixed. New inventory arriving — at auction, at competitors, from lease returns — is what moves a specific segment, and that supply is visible a few weeks out and genuinely unknown beyond that.
Which decisions does each horizon support?
This is the practical part, and it maps cleanly.
0–30 days — pricing decisions. Where to position a unit now, whether to reduce this week, whether a reduction is likely to be needed soon. This is the window that matters for everything in repricing, and it is the window forecasts are good at.
30–90 days — exit decisions. Whether to keep retailing an aged unit, which is a comparison between an uncertain retail path and a near-certain wholesale number today. The uncertainty is already built into the exit arithmetic through the expected-reduction term.
90 days+ — nothing specific. This horizon should inform direction rather than decisions. "Supply in this segment is tightening" is usable. "This unit will be worth $13,400 in four months" is not.
The question to ask of any forecast
What decision does this support, and over what horizon?
Decision Horizon needed Forecast reliable there? Reduce this unit this week 7 days Yes List price on a unit arriving Friday 14 days Yes Hold or wholesale a 68-day unit 30 days Mostly Buy three of this model at auction 45–60 days Marginal Commit to a segment for the quarter 90 days No Rows four and five are where forecasts get used beyond their range. A stocking decision made on a 60-day price projection is leaning on the least reliable part of the curve — which is why stocking should rest on your own results rather than on a price forecast.
What breaks a forecast?
New-car supply and incentives. The largest single driver of used values and the hardest to anticipate. An incentive programme announced on a Tuesday moves a segment within weeks.
Lease return volume. Predictable in aggregate and lumpy in a specific market.
Rate movements. They change payment affordability, which changes which segment a given buyer shops, which moves demand between bands rather than overall.
Fuel prices. A fast and large effect on specific segments, and essentially unforecastable.
Local events. A plant, an employer, a weather event. Invisible in regional data until after the fact.
All five share a property: they are step changes rather than trends. That is why forecast error does not grow smoothly with horizon — it grows in jumps, at unpredictable moments, which is also why a confidence band that widens smoothly is describing the wrong kind of uncertainty.
How do you use a forecast you cannot fully trust?
Three practices that make an imperfect forecast useful.
1. Use direction, not level. "This segment is softening" is actionable and robust. "This unit will be worth $13,400" is neither.
2. Prefer the short decision. If a decision can be deferred into the reliable window, defer it. Pricing weekly rather than monthly is partly a forecasting argument: each decision only needs seven days of reliability.
3. Make the forecast reversible. A price can be changed next week. A unit bought cannot be unbought. Weight the forecast heavily where the decision is reversible and lightly where it is not — which is the actual reason stocking should lean on your own history rather than on projections.
Where does price prediction go wrong?
1. Used beyond its horizon. Stocking and segment commitments made on 90-day projections.
2. Point estimates with no range. A single number at 60 days implies a precision that does not exist.
3. Confidence bands that widen smoothly. The real risk is a step change, not a widening cone.
4. Fitted on too little local data. A small store cannot fit a local seasonal effect; regional data is better for that specific purpose, and your own turn rate by segment is better than either for weighting.
5. Not validated against your own results. The only way to know the horizon where your tool stops being useful is to check it.
6. Treated as a market view rather than a unit view. Segment forecasts and individual unit outcomes are different questions, and condition dominates at the unit level.
What should you measure?
| Metric | How to compute | What it tells you |
|---|---|---|
| Forecast error by horizon | Predicted vs actual, bucketed by days ahead | Where your tool stops being reliable |
| Error by segment | Split | Which segments are forecastable at all |
| Decisions made per horizon | Audit what you actually use it for | Whether you are inside the window |
| Direction accuracy | Did it get up/down right, ignoring level | Usually much better than level accuracy |
| Step-change detection lag | Days between a market move and the forecast reflecting it | The real risk measure |
| Error vs confidence band | Share of actuals inside the stated band | Whether the confidence is honest |
Row four is the one worth building a habit around. Most forecasts are considerably better at direction than at level, and a tool that reliably says "softening" or "firming" by segment is useful even when its numbers are not.
Frequently asked questions
How far ahead can used car prices be predicted reliably?
Weeks rather than quarters. The reliable window runs to roughly 30 days, where the supply of substitutes is largely fixed, and degrades through 90 days as seasonality, auction supply and rate movements come into play. Beyond that, forecasts inform direction rather than decisions.
Which decisions can a price forecast support?
Pricing decisions inside about 30 days, where the forecast is good, and exit decisions out to around 90 days, where the uncertainty is already built into the comparison against today's wholesale value. Stocking and segment commitments sit beyond the reliable window.
What breaks a used car price forecast?
New-car supply and incentive announcements, lease return volume, rate movements, fuel prices and local events. All are step changes rather than trends, which is why forecast error grows in jumps rather than smoothly — and why a confidence band that widens evenly describes the wrong kind of risk.
Should stocking decisions be made on price forecasts?
Not primarily. A stocking decision needs a 45 to 60 day horizon, which is the least reliable part of the curve, and the decision is irreversible once the unit is bought. Your own days-to-sale and gross by segment are a better basis, with forecasts used as a sense-check on direction.
Is direction more reliable than level?
Usually, by a wide margin. A tool that correctly says a segment is softening or firming is useful even when its specific numbers are poor, and measuring direction accuracy separately from level accuracy is worth doing because the two differ so much.
Why do confidence bands mislead?
Because they typically widen smoothly with horizon, which models gradual uncertainty. The actual risk in used car values is a step change at an unpredictable moment — an incentive announcement, a fuel price move — and a smooth cone does not represent that at all.
How do you validate a pricing tool's horizon?
Compare its predictions against actual outcomes, bucketed by how many days ahead each prediction was made, and split by segment. That produces the horizon at which your tool stops being useful for your market, which is a more honest answer than any vendor specification.
Should a forecast be applied to an individual unit?
Cautiously. Segment forecasts and individual unit outcomes are different questions, and at the unit level condition dominates everything the forecast can see. A segment view combined with unit-specific condition knowledge is the working combination.
Conclusion
- Reliable to about 30 days, where the supply of substitutes is roughly fixed.
- Match the decision to the horizon. Pricing inside 30, exit to 90, stocking on your own history.
- The risk is a step change, not a widening cone. Confidence bands model the wrong thing.
- Direction beats level by a wide margin, and is worth measuring separately.
- Weight forecasts by reversibility. A price changes next week; a unit bought cannot be unbought.
Last updated: