Dealer group consolidated reporting is the practice of producing one comparable set of numbers across every rooftop in the group. Nearly every group does it by hand, in a spreadsheet, every Monday. The obstacle is almost never the tooling. It is that two stores running the same DMS can define the same metric differently, and no dashboard can reconcile definitions that were never agreed.
This guide covers why the group spreadsheet survives, which definitions diverge between rooftops, what a consolidated layer actually requires, and the order to fix things in.
Why does the group spreadsheet survive?
Because it is the only thing that can absorb the differences between stores, and a human is the only thing that can hold those differences in its head.
The Monday routine is the same at almost every group: someone pulls a report from each rooftop, pastes it into a master workbook, adjusts a few numbers they know are counted differently at store 3, and sends a PDF. It is slow, it is one person's undocumented knowledge, and it is a single point of failure — but it produces a number the GM believes.
Every attempt to replace it with a dashboard runs into the same wall. The dashboard sums what the stores report. The person did not sum: they reconciled. Take the human out and you get a number that is fast, automated, and wrong in ways nobody can locate.
So the spreadsheet comes back, and the group concludes that group reporting is a hard technical problem. It is not primarily a technical problem.
What actually diverges between rooftops?
Four things, in the order they cause trouble. Every one of them is a definition, not a system.
1. What counts as a lead. Store 1 counts a duplicate submission as one lead. Store 2 counts two. Store 3 excludes chat transcripts without a phone number. Store 4 includes service inquiries. Nothing is wrong at any store — but their close rates are not comparable, and the group ranking built on them is fiction. This compounds with the duplication already present inside each CRM.
2. When a sale is counted. Delivery date, contract date, or funded date. A group mixing all three cannot close a month cleanly, and the discrepancy always appears in the last three days — exactly when the number matters most.
3. What sits in gross. Pack, reconditioning policy, doc fee treatment and internal service charges vary by store, sometimes by brand requirement. Two stores with identical gross per unit can be running very different businesses.
4. How aging is clocked. From acquisition, from title received, or from frontline-ready. A store measuring from frontline-ready looks dramatically better on days to sell than one measuring from acquisition, and the difference is nothing but a start date.
How a definition gap becomes a false ranking
Illustrative. Run it on two of your own rooftops.
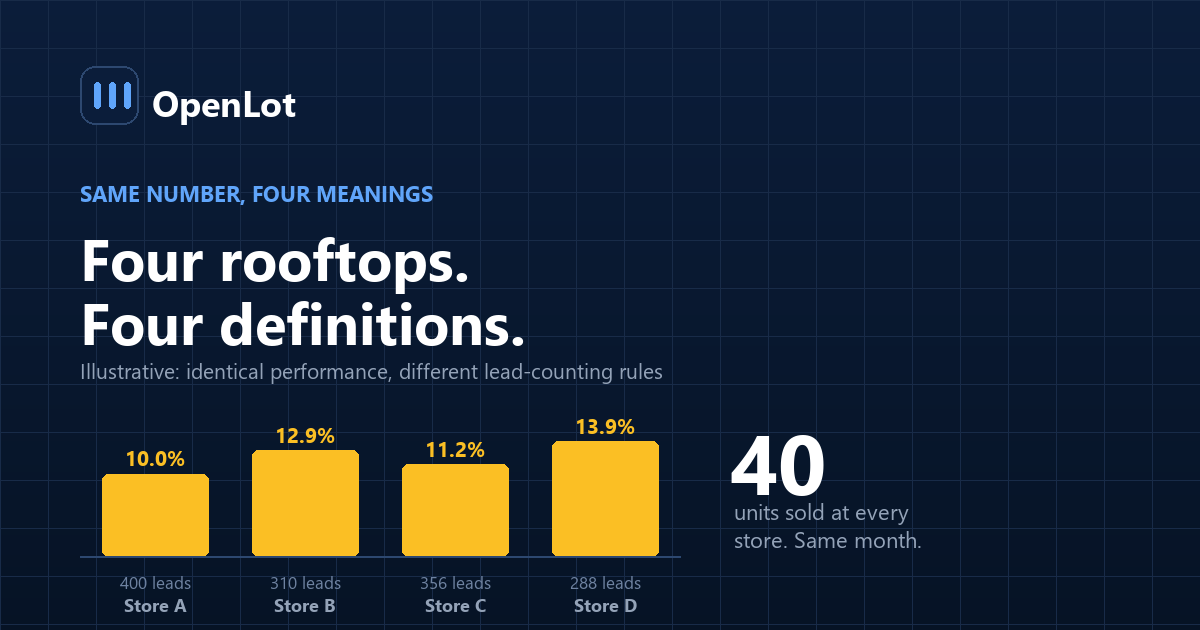
Two stores each sell 40 units from internet leads in a month.
- Store A counts every submission as a lead: 400 leads → 10.0% close rate
- Store B deduplicates before counting: 310 leads → 12.9% close rate
Store B appears 29% better. The two stores performed identically. The entire gap is a counting rule.
Now consider what that ranking is used for: the group praises B, pressures A, and moves marketing budget toward B's sources. Three decisions, all made on an artifact of the definition.
The tell is that the gap is suspiciously stable month over month. Real performance differences move around. Definition differences do not.
What does a consolidated layer actually require?
Four components. Buying a dashboard supplies only the fourth, which is why dashboard-first projects stall.
1. A definition dictionary. One page per metric: the formula, what is included, what is excluded, and the timestamp that starts and stops the clock. Agreed by the group, not by each store. This is the whole project, and it is unglamorous enough that it usually gets skipped.
2. A copy of the underlying data, not the reports. Store-level summary reports cannot be re-cut. If store 3 counted leads differently, you need the lead records to recount them under the group definition — which means pulling the raw rows out of each system, the same integration problem every other project hits.
3. A shared key. A way to identify the same vehicle, customer or deal across rooftops. Groups that sell inventory between stores and cannot follow a VIN across them will double-count or lose units at the boundary.
4. Somewhere to put it. Storage in an account the group controls, refreshed daily. Owning it also makes it a continuity asset rather than only a reporting one.
Why store-level reports cannot be added up
This is the single most expensive misunderstanding in group reporting, so it is worth being explicit.
A report is already an aggregation, and an aggregation carries its own definitions. Once store 3 has summarized its month into "412 leads, 39 sales," the information needed to recount those leads under a different rule is gone. You can add the numbers. You cannot correct them.
Pull rows, not summaries. Aggregate once, at the group level, under one definition. Any architecture that aggregates at the store and sums at the top will reproduce the spreadsheet's problems with none of its flexibility.
What should a group dashboard actually show?
Fewer numbers than most, and always with the comparability made visible.
| Layer | Question it answers | Refresh |
|---|---|---|
| Group roll-up | Are we ahead or behind, overall | Daily |
| Rooftop comparison | Which stores diverge from the group | Daily |
| Trend by store | Is a store improving or drifting | Weekly |
| Exception list | Which specific units, deals or leads need action | Daily |
Two rules that keep it honest:
Show the definition next to the number. A metric on a group dashboard should be one click from its dictionary entry. It ends the meeting argument about whose number is right, which is otherwise the recurring cost of the whole exercise.
Flag stores that cannot yet be compared. If store 4 has not migrated to the group lead definition, mark it. A visible asterisk protects the report's credibility far better than a silently wrong comparison, and the report's credibility is the only reason anyone will act on it.
The exception list matters more than the roll-up. A GM cannot act on "used gross is down 4% across the group." They can act on "these eleven units at store 2 crossed 60 days this week."
What order should a group fix this in?
Definitions first. It is the reverse of how these projects usually start, and it is why they usually stall.
- Pick the five metrics that actually drive decisions. Not thirty. Units, gross, lead count, close rate, aged share is a defensible starting five.
- Write the definition for each, and get the store GMs to argue it out until they agree. Expect this to be uncomfortable — it makes visible that some stores have been reporting favorably.
- Audit what each store does today against the agreed definition. The gaps are your migration list.
- Pull raw rows daily into storage the group owns.
- Build the roll-up and the exception list. This is the fast part once the first four are done.
- Retire the spreadsheet deliberately, by running both in parallel for a month and reconciling the differences. Every difference is either a bug or an undocumented rule the spreadsheet was applying.
Step 6 is where the last of the undocumented knowledge gets written down. Skipping it is how groups end up running the dashboard and the spreadsheet forever, which is worse than either alone.
Frequently asked questions
Why can't a dealer group just sum each store's reports?
Because a store report is already aggregated under that store's own definitions, and the detail needed to recount it under a group definition is gone. Summing produces a fast number that is wrong in ways nobody can trace. Consolidation requires pulling raw records and aggregating once, at the group level.
What is the most common metric definition difference between rooftops?
Lead counting. Stores differ on whether duplicate submissions count once or several times, whether chat without a phone number counts, and whether service inquiries are included. Because lead count is the denominator of close rate, the difference distorts every ranking built on it.
How do you know a difference between stores is real and not a definition gap?
Check whether the gap is stable. Real performance differences fluctuate month to month; differences caused by counting rules stay remarkably constant. A store that is consistently exactly 25% better on one metric and unremarkable on everything else is usually counting differently.
What should a dealer group's consolidated dashboard include?
A daily group roll-up, a rooftop comparison, a weekly trend by store, and a daily exception list of specific units, deals or leads needing action. The exception list drives more behavior than the roll-up, because managers can act on named items rather than on percentages.
Where should consolidated dealer group data be stored?
In an account the group owns and controls, refreshed daily, in a format readable without any vendor's software. That makes the same dataset serve reporting and business continuity, and it prevents the consolidation layer from becoming a new dependency.
How long does it take to replace the group reporting spreadsheet?
The technical build is the short part. Agreeing definitions across store GMs and auditing what each rooftop does today typically takes longer than the pipeline and dashboard combined. Groups that start with the dashboard usually stall and go back to the spreadsheet.
Should each rooftop keep its own reporting?
Yes, for operational use inside the store. The group layer exists to compare, not to replace. Problems begin when store-level reports are treated as group inputs rather than as store tools — that is precisely the summing error.
Conclusion
- The spreadsheet survives because it reconciles, and dashboards sum. That is the whole difference.
- Four definitions cause most of the trouble: what a lead is, when a sale counts, what sits in gross, when aging starts.
- A definition gap produces a stable false ranking, and budget follows it.
- Pull rows, not summaries. Aggregation destroys the detail you need to recount.
- Show the definition next to the number, and flag stores that are not yet comparable.
- Definitions first, dashboard last. The reverse order is why these projects stall.
Take one metric — close rate — and write down how each of your rooftops actually computes it today. If two stores differ, every group ranking you have made a decision with has been comparing two different things.
Last updated: